The main idea in short
Smart charging utilises the flexibility of recharging requirements. This is often displayed in a lower recharging duration than actual connection time of the EV to the grid. This charging time can be scheduled to achieve specific goals. A common goal is to minimize electricity costs. This is possible because many electricity retailers offer dynamic electricity price contracts where the electricity price differs for each hour of the day.
This brief overview introduces the concept of smart charging. To understand the variation in electricity prices, the first section provides an overview of the day-ahead electricity market. Given the crucial role of the electricity grid in managing EV integration, the second section describes its fundamental components. The final section presents a summary of the various EV charging options available.
Design of the day-ahead market
Electricity can be traded on various power exchange markets, across different bidding zones, and for different time slots. Most smart charging applications focus on the day-ahead market. The day-ahead market is an auction market. In this market, both electricity producers and consumers can submit bids for each hour of the next trading day. Due to practical constraints, private households typically do not place bids directly. Instead, they usually have a contract with an aggregator or a local power company. This entity handles the electricity purchasing on behalf of its customers. They use consumption forecasts to determine the amount of electricity needed and buy it in bulk for all their clients. These electricity consumers submit bids specifying the amount of electricity they want to buy, the price for that amount, and the hour of consumption. Producers submit bids in a similar format, but their goal is to sell electricity, not to buy it.
Both, producers and consumers must submit their bids for each individual hour of the day to the power exchange market provider. The power exchange market provider uses all submitted bids to determine the accepted bids and the price by clearing the market. The following picture illustrates the process of market clearing.
The green blocks represent electricity producer bids, where the height indicates the price they are willing to accept and the width represents the amount of electricity they are willing to produce. These blocks are sorted by price, forming the supply curve, which shows the relationship between supply and price.
The blue blocks represent consumer bids, where the height indicates the price they are willing to pay and the width represents the amount they want to purchase. When sorted by price, these blocks form the demand curve, illustrating the relationship between demand and price.
The point where these two curves intersect (indicated by the yellow lightning bolt) is called the equilibrium. At this point, the market clearing price is determined, balancing supply and demand. The same amount of electricity is sold by producers as is bought by consumers.
All supply bids with prices below the equilibrium price are accepted, as are all demand bids with prices at or above the equilibrium price. Consequently, all producers receive at least the price they were willing to accept, and all consumers pay no more than the price they were willing to pay. This results in an efficient and fair outcome for both parties.
Matching supply and demand occurs for each hour of the day, resulting in 24 distinct market outcomes daily. This means there can be a different price for each hour, influenced by factors such as varying demand (e.g., higher electricity consumption by private households in the morning and evening) and fluctuating supply (e.g., increased solar power on sunny summer days).
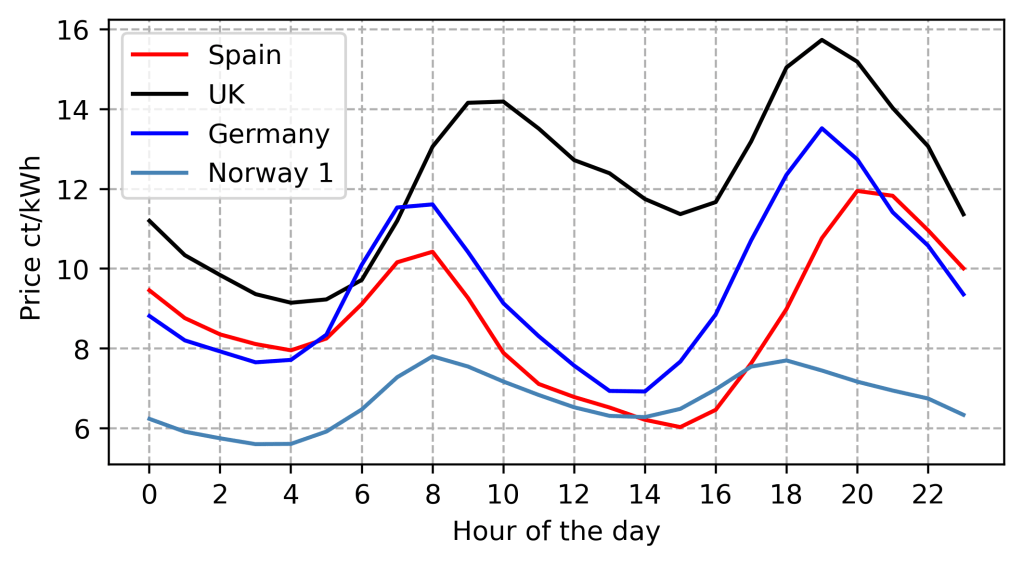
On average, the electricity price curve exhibits a typical pattern throughout the day: low prices during the night, a price peak in the morning, lower prices during the day, and a second peak in the evening. The image below shows the average prices for different bidding zones for the year 2023. You can see that while all these curves follow the same general pattern, they differ in terms of the magnitude of the price peaks and the overall price level.
Electricity Grid
The electricity grid is the infrastructure required to transport electrical energy from producers to consumers. Producers feed electricity into the grid, while consumers draw electricity from it. Electricity grids consist of power stations, electrical substations (to step voltage up or down), electric power transmission (to carry power over long distances), and electric power distribution systems to customers. The combined transmission and distribution system is known as the power grid. The image below shows a simplified version of the electricity grid as adopted in most regions.
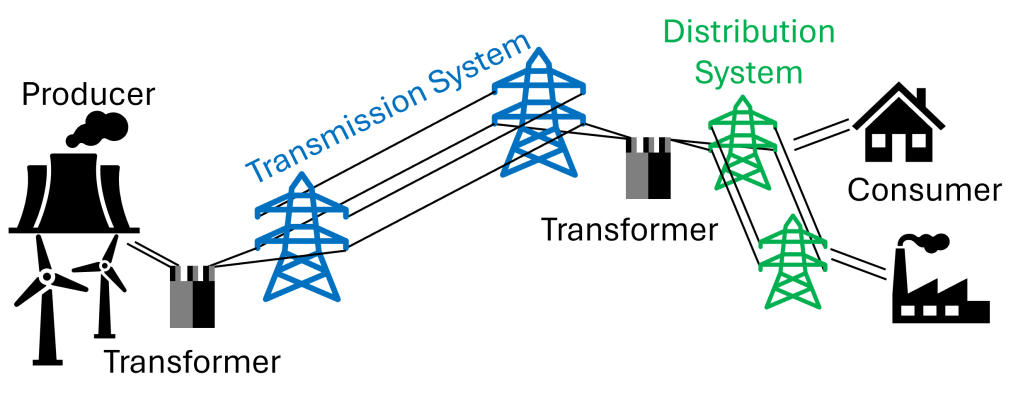
The transmission system transports electricity from producers over long distances at high voltages to transformers, which are connected to local distribution grids. These distribution grids operate at lower voltages and deliver electricity to consumers. Due to the technical nature of an electrical grid, it is not possible to store electricity in the grid itself. Therefore, supply and demand always have to match (see Design of the day-ahead market above).
Two major and simple key figures are used when evaluating the performance of an electricity grid: Load Factor and Power Losses.
Load Factor: This metric is calculated by dividing the average load by the peak load of the system. It is used to evaluate the load profile for the dimensioning of the system. As the peak load has to be covered (otherwise a blackout occurs), this figure represents average capacity utilization. High peak loads (compared to the average load) necessitate over-dimensioning of the grid, causing capacity to sit idle for long periods. This can be seen by a low load factor.
Power Losses: This key figure describes the actual losses in the power system. Due to component resistance and the physical length of the transmission lines, there are unavoidable differences between the energy fed into the grid and the actual energy supplied to end-users. Electricity consumption does not always lead to the same power losses. Consuming electricity during periods of high overall demand results in significantly greater power losses. When the power in the system is doubled (which often happens during peak hours), the power losses increase not just by two but by four times.
Why should we care about power losses or load factors when thinking about smart charging? Usually, the grid operator covers the financial burden of power losses and passes the bill to customers through grid tariffs. These customers include EV owners. Charging an EV during already peak hours forces the grid operator to expand the grid, causing high investment costs. The grid operator can pass this to its customers by overall higher grid tariffs. The design of this grid tariff can vary significantly, from fixed monthly fees to variable fees based on actual power consumption during each hour of the day. In a dynamic pricing setting, grid fees are higher during peak load hours and lower during off-peak hours. Here, operational power losses are translated into operational fees, which can then be considered by smart charging applications.
EV owner flexibility
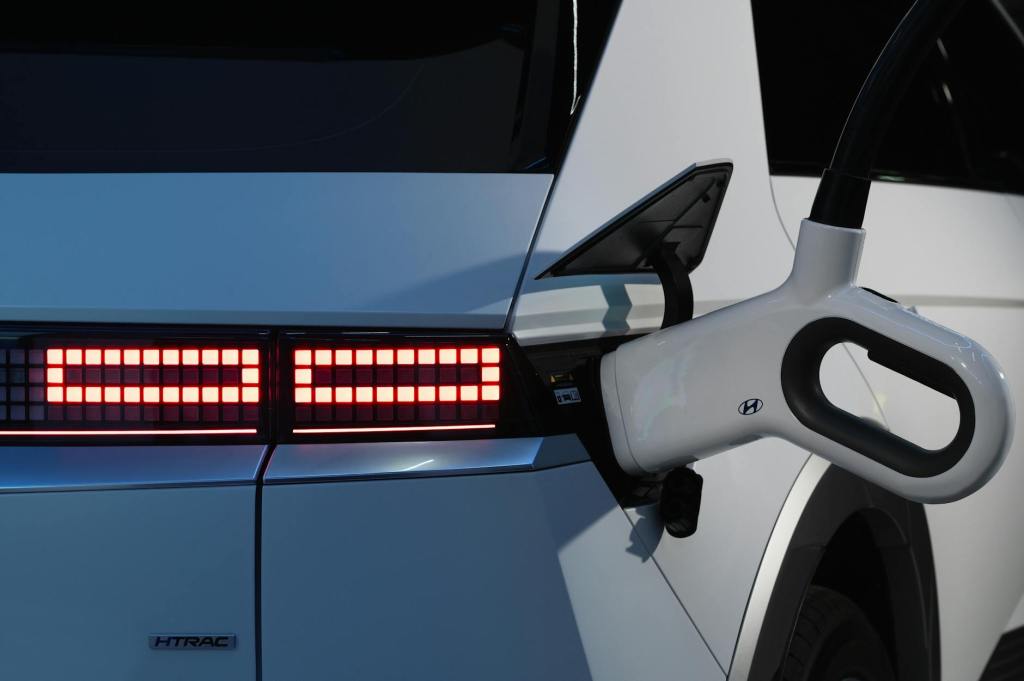
As discussed in previous sections, the time it takes to charge an EV is crucial as it indicates the flexibility the EV can provide. Both EVs and their charging devices are rapidly advancing. Modern EV batteries typically range from 30 to 100 kWh.
EV charging initially involved simply plugging the vehicle into a home socket, resulting in a power output of around 2.3 kW. This method is known as Level 1 charging and takes between 13 and 22 hours to fully charge an EV. While Level 1 charging is still an option, it is generally not recommended due to safety concerns, such as the risk of fire.
Today’s most common approach is to use a wallbox, which is installed by professionals and meets specific safety standards. This method, known as Level 2 charging, provides an output power of between 7.4 and 22 kW, reducing the charging time to between 3 and 7 hours. Level 2 charging enables smart charging because it reduces the charging time sufficiently to offer flexibility over short time periods, such as overnight. Additionally, it allows a third-party company (like your electricity retailer) to control the charging device, enabling the scheduling of charging activities to e.g. minimize costs.
There is also Level 3 charging, or fast charging, primarily used in public spaces. These chargers deliver between 50 and 150 kW and are often installed at grocery store parking lots or along highways, allowing you to charge your car quickly while shopping or travelling. These charging stations are typically not used for smart charging, as their goal is to charge the car as quickly as possible.

Leave a comment